How to Make the Best Use of Your Data Depending on Data Maturity
In today’s digital economy, data is the currency of innovation. Yet, according to a study by NewVantage Partners, only 24% of organizations consider themselves data-driven, even though 91% say data is critical to business success. This disconnect arises because most businesses underestimate the importance of data maturity—how prepared and capable an organization is to leverage data effectively.
Whether you're just beginning your data journey or you're already using advanced predictive models, maximizing your data's value depends on understanding where you stand and what steps to take next. This blog explores five progressive stages of data maturity—each with tailored strategies—and concludes with a powerful implementation approach using the CORSICA Framework.
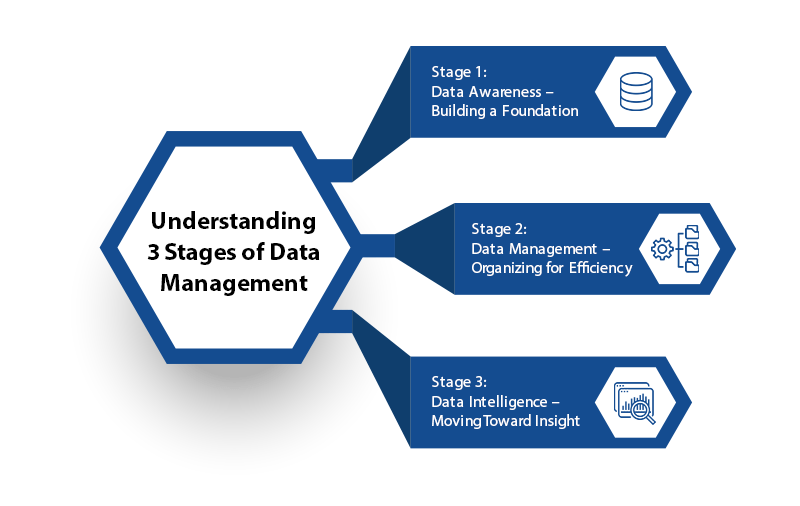
Stage 1: Data Awareness – Building a Foundation
At the very beginning of the data maturity journey, organizations are in the Data Awareness stage. This is where businesses start recognizing the strategic importance of data, but lack the tools, processes, and culture to use it effectively. The focus here is on understanding what data exists, where it lives, and how it might be used—even if only in basic forms.
Understanding What Data You Have
The first step in building a data-driven organization is acknowledging what kind of data your business currently collects. It could be as simple as sales transactions, website analytics, customer contact details, or HR attendance logs. Most companies don’t even realize how much raw data they’re generating daily. Without taking stock of these assets, it’s impossible to identify their potential value. This stage is all about creating awareness—what’s coming in, what’s being stored, and what’s being discarded without a second thought.
Breaking Down Silos
In early-stage organizations, data often resides in isolated pockets—marketing has their own reports, finance works in their spreadsheets, and operations manage completely separate systems. These data silos prevent holistic decision-making. Breaking down these barriers doesn’t mean forcing everyone onto the same system immediately, but it does mean opening up communication between teams and laying the groundwork for integrated data use. When departments start sharing insights, data becomes a shared asset—not a departmental burden.
Defining Basic Governance
Data without governance is like water without a container—it leaks, spills, and causes chaos. Even in the earliest stages, it’s essential to put basic governance practices in place. This means establishing data ownership, setting access permissions, and defining accountability. Who is responsible for the accuracy of data? Who approves changes? While a full governance framework may come later, even a simple structure can prevent confusion and ensure that data is treated with the seriousness it deserves.
Prioritizing Data Literacy
You can have the most accurate data in the world, but if your people don’t know how to read or interpret it, it’s as good as useless. Building a data-aware culture starts with improving data literacy—the ability to understand, question, and use data effectively. This doesn’t require turning every employee into a data scientist, but it does mean ensuring everyone—from customer service to C-level executives—feels confident interacting with data tools and reports. Simple training sessions, cheat sheets, or interactive workshops can work wonders here.
Identifying Critical Use Cases
Rather than trying to boil the ocean, organizations at this stage should focus on one or two high-impact use cases. For example, a retail business might want to use sales data to optimize inventory. A nonprofit might want better insights into donor engagement. By choosing a specific area of improvement, organizations can demonstrate quick wins with data—and build momentum for more advanced projects. Use cases should align with business pain points, not just what's trending in tech.
Starting with Descriptive Reporting
In the Data Awareness stage, the goal isn’t to predict the future—it’s simply to understand what has already happened. Descriptive reporting provides visibility into past performance and trends through simple dashboards, charts, or summary reports. These basic reports help leaders understand operational performance at a glance—like how many leads were generated last month or how revenue compared to last quarter. Tools like Excel or Google Data Studio are often used at this stage, and that’s perfectly okay. The key is starting somewhere.
Stage 2: Data Management – Organizing for Efficiency
Once an organization becomes aware of its data landscape, the next step is to bring structure and control. In the Data Management stage, the focus shifts to organizing data for consistent use, improving its quality, and laying down infrastructure for efficient access and reuse. This is where businesses move from chaos to clarity—from scattered data sources to cohesive, well-managed systems.
Centralizing Data Repositories
The most common pain point at this stage is fragmentation—data spread across multiple systems, formats, and teams. To address this, organizations begin centralizing their data in repositories such as data warehouses or data lakes. This doesn’t mean ripping and replacing existing systems, but rather establishing a unified data environment where all business data can be stored and accessed in a consistent manner. Centralization helps eliminate duplication, streamlines reporting, and prepares the ground for analytics.
Ensuring Data Quality
Data, if not maintained properly, quickly becomes outdated, inconsistent, or flat-out wrong. Poor data quality can lead to bad decisions and eroded trust among stakeholders. At this stage, organizations begin implementing validation checks, error tracking, and regular cleansing routines to ensure accuracy, completeness, and timeliness. For example, cleaning up customer records to remove duplicates or correcting inconsistent naming conventions across regions helps improve overall reliability.
Enhancing Metadata Management
Metadata—essentially, the "data about data"—is often overlooked but incredibly valuable. It provides context: who created the data, when, what it represents, and how it’s structured. Businesses at this maturity stage begin tagging and documenting their datasets properly so users can understand and trust what they’re working with. Metadata management also simplifies data discovery and accelerates onboarding for new team members.
Establishing Role-Based Access
As more people start using centralized data, access control becomes critical. Role-based access ensures that users can only view or manipulate data relevant to their role. For example, while a marketing manager may need access to campaign data, they likely don’t need to see payroll information. These security measures not only protect sensitive information but also reduce the risk of accidental changes or data misuse.
Automating Data Pipelines
Manual data handling is slow and error-prone. To scale efficiently, businesses begin automating data collection, transformation, and loading through ETL (Extract, Transform, Load) pipelines. This means customer behavior data from a website can be automatically pulled into a database, cleaned, and formatted for reporting—without any manual intervention. Automation speeds up insights, reduces errors, and frees up team capacity for higher-value tasks.
Implementing Standard Reporting Tools
At this point, spreadsheets aren’t enough. Organizations adopt business intelligence (BI) tools like Power BI, Tableau, Qlik, or Looker to create standardized, interactive dashboards and reports. These tools connect directly to centralized data sources, allowing real-time visualizations and dynamic filtering. As a result, decision-makers across departments get a consistent view of performance—and can make faster, more informed decisions.
Stage 3: Data Intelligence – Moving Toward Insight
With data now centralized, cleaned, and organized, organizations can finally begin to extract real value from it. Stage 3: Data Intelligence is where the shift happens—from simply managing data to understanding it. This stage is marked by meaningful insights, diagnostic analysis, and a more strategic alignment of data efforts with business goals. It’s no longer just about what happened—it’s about why it happened and what can be done about it.
Enabling Self-Service Analytics
Gone are the days when only data analysts or IT teams could generate reports. In this stage, businesses invest in self-service analytics platforms that empower non-technical users to explore data independently. Whether it's a sales manager pulling a weekly performance report or a marketer analyzing campaign conversions, self-service tools reduce bottlenecks and foster a culture of curiosity. When data is accessible, people are more likely to use it.
Using Diagnostic Analytics
While descriptive analytics looks at the past, diagnostic analytics goes one level deeper—it uncovers the reasons behind the outcomes. For instance, not just noting a drop in sales, but discovering it’s linked to a regional supply chain issue or competitor activity. Diagnostic analytics relies on pattern recognition, correlation analysis, and drill-down capabilities. This level of insight enables more strategic decisions rather than reactive guesswork.
Creating Data Personas
Not all users interact with data the same way. A data scientist has different needs than a customer service rep. By defining data personas—archetypes like “data producers,” “data consumers,” or “data champions”—organizations can tailor tools, training, and dashboards to meet the needs of each role. This ensures people get access to relevant data in the right format, reducing frustration and increasing adoption across the enterprise.
Establishing Data Stewardship
At this stage, the complexity of data increases, and with it, the need for clarity and consistency. Data stewards play a vital role here. They ensure that data is properly defined, documented, and governed. They help resolve conflicts in definitions (e.g., what exactly counts as a “qualified lead”), manage data dictionaries, and serve as trusted advisors between business and IT teams. Their work builds trust in the data and ensures consistency across departments.
Aligning Analytics with Business Goals
Analytics should never be pursued in isolation. At the intelligence stage, organizations begin to map their analytics efforts directly to strategic business objectives. For example, if the goal is to reduce churn, analytics might focus on customer behavior patterns and feedback. If it's operational efficiency, the lens might shift to resource utilization or cycle times. Aligning data use cases with business KPIs ensures relevance, focus, and measurable value.
CORSICA Framework Implementation: From Chaos to Clarity with a Practical Data Roadmap
Making the best use of your data isn’t just about tools—it’s about translating information into action. That’s where Espire’s CORSICA Framework becomes a game-changer. Instead of overwhelming organizations with high-level strategy or isolated tech stacks, CORSICA offers a step-by-step, real-world approach to maturing your data capabilities—aligned to business goals and scaled to fit your current stage of readiness.
Here’s how each step in the CORSICA Framework helps unlock the value of your data:
Collect
The journey starts with data discovery. In this phase, we work with you to identify and inventory all relevant data assets—from structured databases and customer forms to unstructured feedback, logs, and documents. It's about knowing what you have, where it's coming from, and how it's currently being used. Often, this is where businesses uncover hidden data sources or redundant silos they didn’t even know existed.
Organise
Once your data is collected, the next step is to bring structure and consistency. This means standardizing formats, improving data quality, eliminating duplicates, and tagging information for easier access. Organizing data also includes classifying it based on relevance, sensitivity, and purpose. The result? A cleaner, centralized foundation that sets the stage for deeper analysis.
Report As-Is State
Before rushing into solutions, it’s important to understand where you are right now. This stage involves creating transparent reports and dashboards that reflect your current business performance, process bottlenecks, and data reliability. These “as-is” reports offer an honest snapshot of what’s working, what isn’t, and where the data gaps lie. It builds clarity—and gets everyone on the same page.
Scoping Key Issues
With a clear view of the present, we now zoom in on the business-critical issues that need solving. Whether it's high customer churn, rising operational costs, or low campaign ROI, we work with stakeholders to prioritize challenges based on urgency and impact. This step ensures that your data efforts are focused—not scattered—and tied directly to real-world business pain points.
Insights & Root Cause Analysis
Now comes the shift from raw data to intelligent insight. Using a mix of historical trends, visualizations, and diagnostic analytics, we dive into the 'why' behind the issues. Why are your support tickets increasing? Why is conversion lower in one region? This phase doesn’t just present numbers—it tells stories and uncovers the root causes, enabling smarter decision-making with context.
Change
Insights are only powerful if they lead to action. In this stage, we design and implement targeted interventions—whether that’s process automation, new workflows, customer segmentation strategies, or content personalization. Change is managed with measurable KPIs, so you can track whether the solutions are delivering the desired outcomes.
AI Implementation
The final step in the CORSICA journey is where innovation really kicks in. Once your data is structured and business processes are optimized, we enable AI-driven transformation. From predictive analytics and natural language processing to intelligent automation and personalized recommendations, AI becomes embedded into your business fabric—making decisions faster, smarter, and more scalable.

Conclusion: Your Data Has More to Say—Let’s Help You Listen
Every business has data. The difference lies in how you use it. Maybe you're still figuring out where everything lives, or perhaps you're already exploring AI-powered insights. Wherever you are, moving forward doesn’t have to be overwhelming.
With Espire’s CORSICA Framework, you get a step-by-step approach that’s practical, clear, and built around your unique needs. It’s not about doing everything at once—it’s about making steady, smart progress that delivers real results.
Let’s turn your data into something powerful decisions that make a difference.
Talk to our experts and let’s take the next step in your data journey—together.